If 2011 was a watershed year for Finland with the historic rise of a hostile party against immigrants and visible minorities in last year’s parliamentary elections, 2012 will be seen as a bittersweet turning point for the Perussuomalaiset (PS).
The year will be remembered as a very violent one for immigrants as well. During “Black February,” three Muslims died under violent circumstances in a span of about three weeks in the cities of Oulu and Espoo.
There was no shortage of news about immigrants and minorities in Finland. Some of these were: fines for hate speech to PS politicians like MP Jussi Halla-aho; Helena Eronen’s blog entry suggesting armbands for immigrants; racial profiling complaints to the Ombudsman of Minorities; Migrant Tales got deactivated for about 13 hours without warning from WordPress.

Rebecka Holm, 14, who was awarded the Red Cross Award on the UN Day Against Racism. Holm denounced racial harassment against her friends and herself and wrote about it to Swedish -language daily HBL. She is a good example for immigrants and visible minorities living in Finland.
Visits to Migrant Tales during the year rose by 70% versus 2011.
What grade would Finland receive for promoting and defending cultural diversity in 2012? If the grade was a 5 (below average) in 2011, this year it would go up a tad to +5.
Below is a quarter-by-quarter account of what made news on the immigration and visible minority front in Finland during the year:
First quarter (January-March)
Without a doubt, the biggest story in the first quarter of the year was the presidential elections of January. After the historic victory of the PS in 2011, which won 39 seats in parliament compared with 5 previously, all eyes were on its chairman and hopeful, Timo Soini. Would he repeat the party’s 2011 election result?
The presidential election turned out to be a sour disappointment for the PS. Not only did an openly gay presidential Green Party candidate, Pekka Haavisto, beat Soini but also another anti-EU Center Party’s hopeful Paavo Väyrynen.
The election showed that voters had started to turn their backs on the PS’ anti-EU and anti-immigration rhetoric. Soini’s poor showing (9.4%) and Väyrynen’s better showing (17.5%) confirm the latter. The next hurdle for the PS would be the municipal elections of October 28.
Migrant Tales was cited during the presidential election by Sveriges Radio.
Black February, which involved the death of three Muslims, a suicide and an injured man, started on January 30 in Oulu after eighteen-year-old Abdirashid Jirde fled from three Finns who barged into his home. Fearing for his safety, the young Somali leaped unsuccessfully from his sixth-floor apartment to his neighbor’s balcony.
His brother, Absie Jirde, wrote a letter about his brother’s death that was published on Migrant Tales after the tragedy.
 This picture sent by the brother of the victim (baby) was sent to Migrant Tales by the brother of the victim.
On February 17 Migrant Tales was tipped off about the death of a second Somali youth, Abdisalam Mohamed Abdulahi, who died violently at the hands of a white Finn. Both the assailant and the victim knew each other.
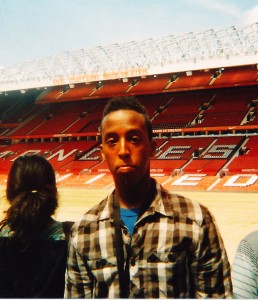 The second Muslim to lose his life violently in Black February was Abdisalam Mohamed Abdulahi, 18. The eighteen-year-old youth was a Manchester United fan.
An Espoo District Court sentenced Abdulahi’s killer in July to a six-year jail term for manslaughter.
Migrant Tales spoke to Abdisalam’s father about the death of his son.
The final chapter of Black February took place the day after on Sunday at an Oulu pizzeria after Abdulahi’s tragic death, when a white Finn shot and killed one worker and wounded another one. The killer took his life after the shooting.
On the night of the tragic events that happened in Oulu, PS councilman Tommi Rautio wrote on his Facebook page the following comment: “If Janne is the one [who shot the foreigners at the pizzeria] then we should give Janne a medal.”
Rautio’s comment caused him to be sacked from the PS in March and convicted and fined 120 euros by a local court for inciting ethnic hatred.
Setting aside the tragic events that marked Black February, few politicians denounced publicly what happened except for Olli Mäntylahti, a National Coalition Party candidate for the city of Helsinki. Migrant Tales was, together with Mäntylahti, the first ones to break the news about Rautio’s comments on Facebook.
Migrant Tales was the target of a number of attacks at the end of the first quarter. The first attack came from a megaboard site called Ylilauta, which was followed by a deactivation by WordPress of the blog on March 27 for about 13 hours.
Writes Mark: “Migrant Tales is under attack. The blog’s founder is receiving threats of violence, is being defamed and ridiculed in public forums, is being harassed even to the point of having his workplace invaded by defamatory communications. It is not an easy time for Enrique or his family…”
 While some were dancing prematurely on Migrant Tales’ grave, we received an apology from WordPress for the mistake. Making sure that we never have to suffer such censorship again, Migrant Tales moved to its present site on May 17.
Freddy Van Wonterghem, a PS Kotka city councilman, was convictedby a court on March 30 for inciting ethnic hatred. On another blog, this editor asked Van Wonterghem if he regretted what he wrote.
“I don’t regret what I wrote…” he responded. “Perhaps [at the most] it wasn’t nicely said.”
Second quarter (April-June)
The biggest stories during this quarter were: Helena Eronen’s blog entry suggesting that immigrants should start wearing armbands, and a Supreme Court ruling that slapped Halla-aho with a fine for defaming a religion and inciting ethnic hatred.
As a result of the court ruling, Halla-aho was forced to resign in June as chairman of the administration committee.
The Supreme Court sentence turned out to be a showdown between Soini’s Rural Party and Halla-aho’s Suomen Sisu faction. Halla-aho suggested that MP Juho Eerola should replace him as chairman of the administration committee.
Soini’s candiate, MP Pirkko Mattila, was elected by the parliamentary group. The result was a clear defeat for the PS Counterjihadists.
Eronen knew she was asking for trouble when she published her infamous blog entry on ethnic profiling.
What did she write?
You’ll find the original blog entry number eighteen on MP James Hirivsaari’s website: “If every foreigner were required to use an armband of his/her national background, the police could immediately spot whether that ‘aha, that is a Muslim from Somalia’ or ‘aha. that is a beggar from Romania.’ Muslims could [use sleeve badges] with a half moon…Russians [with] a hammer and sickle, Kampucheans could have field mines, a burger [could be used to distinguish] Americans…”
Eronen’s story, which was widely covered by the Finnish media, spread rapidly to Russia, Sweden and other countries.
Eronen, who openly supported the far-right Muutos 2011 party, resigned in August as Hirvisaari’s aide. There was speculation that one reason why she resigned was because Hirvisaari’s wife suspected her of having an affair with her boss.

The Council for Mass Media in Finland (JSN) exonerated Kirkko&Kaupunki in May after a cartoon published on December 2011 mocking a group of Perussuomalaiset (PS) party MPs. It reads: “A Merry Christmas to you all Finnish heterosexuals and white conservatives! We wish the rest a shitty Christmas!”
Setting aside the contempt that the PS has for immigrants and visible minorities, Finland’s media was a constant target of attack by the party, especially newspapers like Turun Sanomat, which reported on Eronen’s sleeve badge blog entry.
Attempts by the PS to tell newspapers what and how they should write about the PS is a good example of the party’s anti-democratic credentials. PS members like Matti Putkonen and MP Halla-aho expressed on a number of occasions their anger with the media.
PS MP Olli Immonen, a hardline Counterjihadist, announced that he would boycot YLE “for a while.” Instead of answering difficult questions posed by reporters, the response of some PS members is to avoid the media altogether.
A clear indication of the growing influence of the extremist Suomen Sisu wing of the PS, was the naming in May of Matias Turkkila as the new editor-in chief of the party’s newspaper and web page.
If there is a person who has helped spread Halla-aho’s hate speech in Finland, that person is Turkkila. He’s the editor of anti-immigration hate site called Hommaforum which is closely related to Scripta, Halla-aho’s blog.
Other stories that Migrant Tales reported were Finland’s first suspected terrorism case involving Somalis, ethnic profiling complaints by immigrants to the Ombudsman of Minorities, an elderly Somali woman who got assaulted at a Helsinki metro station, the costly saga of family reunification, and www.migranttales.net begins on May 17.
Third quarter (July-September)
As Anders Breivik was convicted by an Oslo court to 21 years for the murder of 77 innocent victims on July 22, 2011, Peter Mangs, was sentenced to life imprisonment by a Mälmö court in Sweden on two counts of murder and five attempted murders. He was finally sentenced in November after undergoing psychological tests, which showed him to be sane.
Another story that ignited debate was a movie about “black” Marshal Carl Mannerheim, Finland’s George Washington. One of the aims of Erkko Lyytinen, the movie’s producer, was to challenge challenge Mannerheim’s sacred image.

Black and white Marshal Mannerheim spurred a lot of debate in Finland.
The Per-Looks blog, which outraged some PS party members, was widely debated in the media. While the pictures published on Per-Looks aim to give an image that the PS are a bunch of Finnish hillbillies, the blog gave the hostile party to immigrants a taste of its own medicine.
By September the heat of the municipal elections could be clearly felt. A very good blog, Kunnolisvaalit 2012,** appeared exposing the far-right and anti-immigration stands of candidates running for city council. While the majority of the candidates on the blog belong to the PS, there are others from parties like Muutos 2011, Center Party, and National Coalition Party.

Risto Helin of the PS, who got elected to the Vaasa city council, is pictured with a “white power blood & honor” on Kunnollisvaalit 2012 blog.
Another PS municipal candidate that got elected from Kotka, Amon Rautiainen, got in trouble in September for suggesting on his Facebook page that government ministers should be shot and that Muslims should be boiled alive.
Despite constant denials by Soini that the PS wants to weed out racists from running in the municipal election, the party’s policy towards refugees shows that the latter is only lip service. The party’s municipal election program clearly states that municipalities should not accept refugees. The best place to help these people is in crowded refugee camps where “they would be culturally” closer to home, according to the party.
In the end of September, a poll published by YLE shows that the PS will be the biggest winners of the municipal elections. The poll sees the PS getting 17.2% of the votes versus 5.4% in 2008 with the Center Party being the biggest loser.
Fourth quarter (October-December)
The biggest story in this quarter and probably the whole year was the municipal election result. Contrary to what the September poll suggested, the clear winner of the election was the Center Party (18.7%) and the biggest losers were the Greens (8.5%). The PS, which was expected to do well, won 12.3% of the vote. Even if the result was a disappointment to Soini, the party was able to raise the number of city councilpersons by 752 to 1,195.
The National Coalition Party (21.9%) and the Social Democrats (19.6%) came in fist and second place, respectively.
Campaigns like iCount that aim to activate the immigrant vote were active during the election.
The 2012 municipal elections were historic for Finland since a record number were candidates, according to YLE. The highest number of immigrant candidates can be found in the Social Democratic Party (118) followed by the National Coalition Party (81), Left Wing Alliance (56), Green Party (55) and Center Party (around 50).
Unconfirmed reports see the immigrant vote doubling to about 40% in the recent elections. If this is true, it shows that Finland’s anti-immigration climate has empowered immigrants to act.
Contrarily, PS Counterjihadist candidates as well as others that were strongly anti-immigration and against cultural diversity did well in the municipal elections.

PS councilman Harri Turtianen of Kemi is one examples of many of how intolerance has grown and become more acceptable in Finland.
About two weeks after the election, PS MP Hirvisaari said that his party did poorly in the municipal elections because it wasn’t as outspoken on immigration issues as before the 2011 parliamentary elections, according to YLE.
While the campaign in the municipal election became more vicious and anti-immigration rhetoric picked up as October 28 neared, their hostile campaign against immigrants and cultural diversity continued after the election. A draft law spearheaded by Halla-aho aims to make deportations of convicted immigrants mandatory. Three PS MPs have drafted legislation to make begging illegal in public places, and MP Vesa-Matti Saarakkala aims to ban male circumcision in Finland.
Veteran National Coalition Party politician Pertti Salolainen got himself in hot water in early December when he said that on a TV talk show that American Jews have vast control over the wealth and media in the United States. Salolainen, who is vice chairman of the foreign policy committee, felt that pro-Israel lobby groups in the U.S. prevented Washington from taking a neutral stand on the Israeli-Palestinian conflict.

Suspected hate-crime cases were published on December 19. Last year, 2010 figures were made public on October 27.
A total of 918 suspected hate crimes were reported in Finland in 2011, which is a 7% rise from 860 cases in the previous year, according to the Police College of Finland. Compared with the previous years, suspected hate crime cases have not risen significantly, according to researcher Iina Sahramäki.
Mark published two good blog entries after the Police College of Finland published its hate crime cases for last year. The first one, Approaching hate crimes in Finland: problem solver or angry boss and the one that followed, Police College of Finland: are they perpetuating hate, asks some tough questions of the police concerning hate crimes.
He writes: “What adds to the injury is that people rely on these statistics to create profiles of particular national groups as being much more racist than they actually are, and much more racist than Finns. So, hate crime statistics that are presented in such a way that they actually perpetuate hate crime!”
Finnish law doesn’t recognize hate crimes as crimes per se.
In an exclusive interview with Migrant Tales in December, Rainer Hiltunen, Ombudsman for Minorities head of office, said that talks have taken place with the Finnish police to draft new guidelines and more effective monitoring to ensure that ethnic profiling doesn’t happen.
The new guidelines are expected to be in force in 2013.
*See also Finland & Cultural Diversity 2011
** The blog can be read here.